---
title: "Spectroscopy with lcmodel"
linkTitle: "lcmodel"
weight: 1
tags: ["lcmodel"]
author: Steffen Bollmann
aliases:
- /tutorials/spectroscopy/lcmodel
description: >
Using lcmodel, you can analyze MR spectroscopy data.
---
# Spectroscopy with lcmodel
Using lcmodel, you can analyze MR spectroscopy data.
> _This tutorial was created by Steffen Bollmann._
>
> Github: [@stebo85](https://github.com/stebo85)
> Web: [mri.sbollmann.net](https://mri.sbollmann.net/)
> Twitter: [@sbollmann_MRI](https://twitter.com/sbollmann_MRI)
[Getting Set Up with Neurodesk](https://neurodesk.org/getting-started/)
Open lcmodel from the menu: Applications -> Spectroscopy -> lcmodel -> lcmodel 6.3
run
```
setup_lcmodel.sh
```
then run
```
lcmgui
```
We packed example data into the container (https://zenodo.org/record/3904443/) and we will use this to show a basic analysis.
The example data comes in the Varian fid format, so click on Varian:
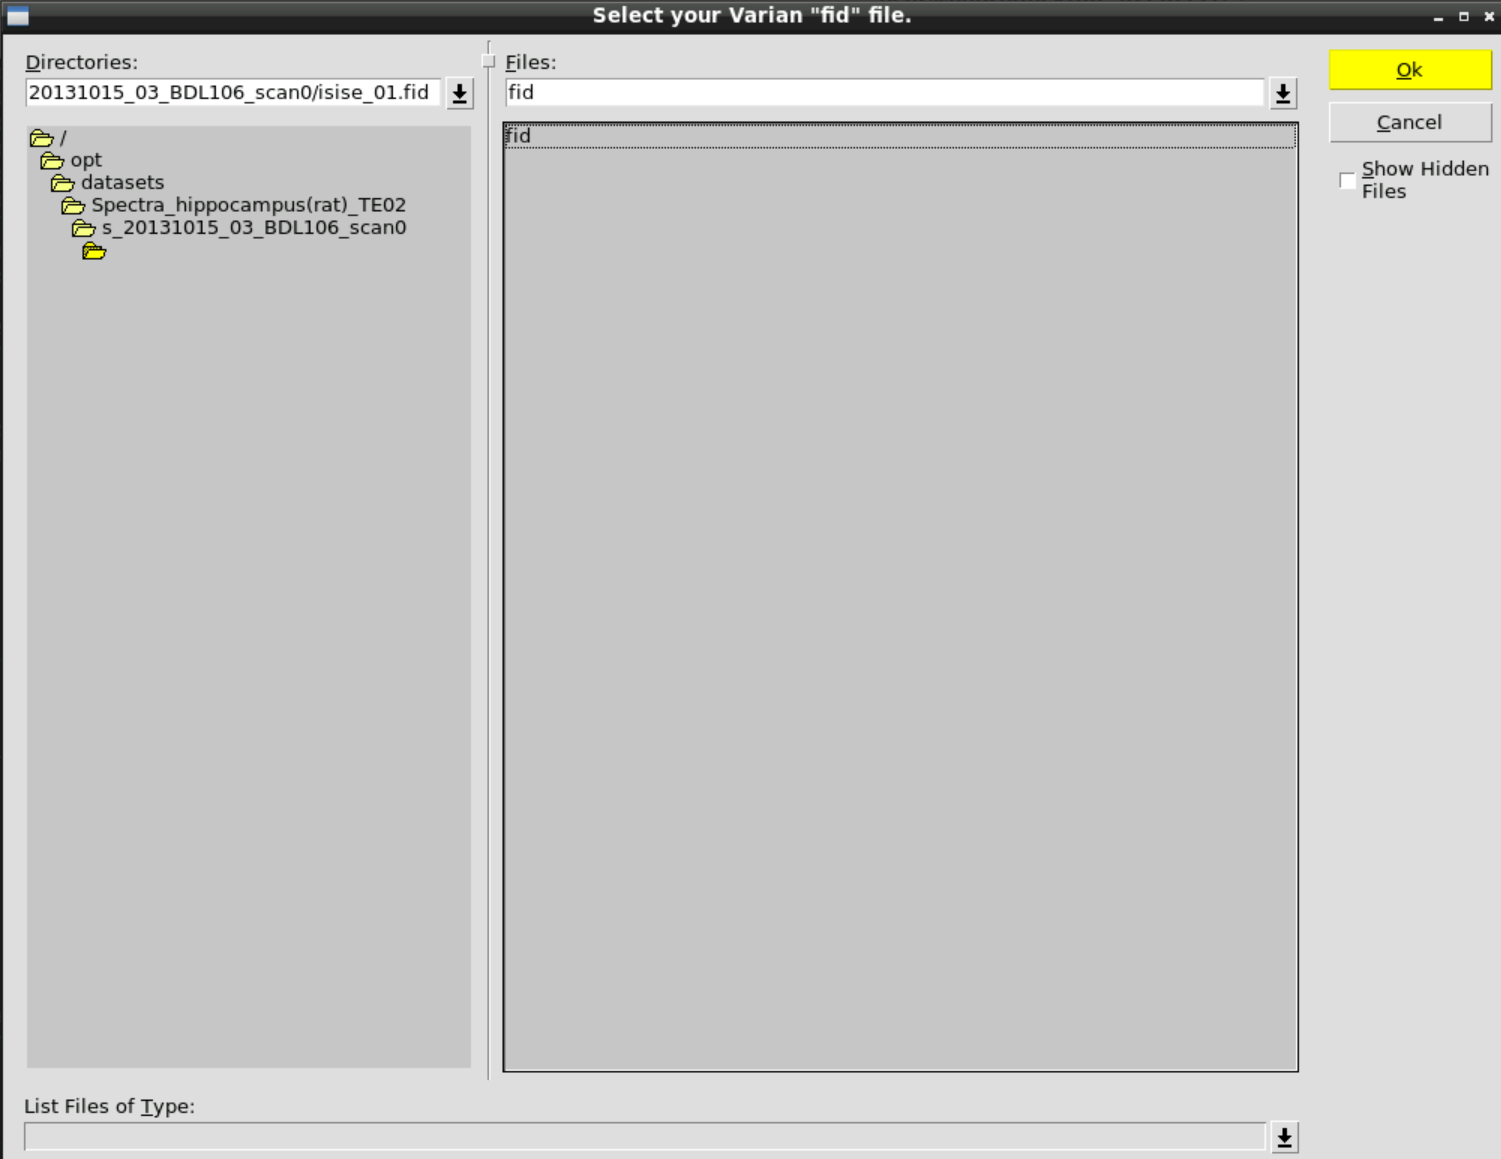
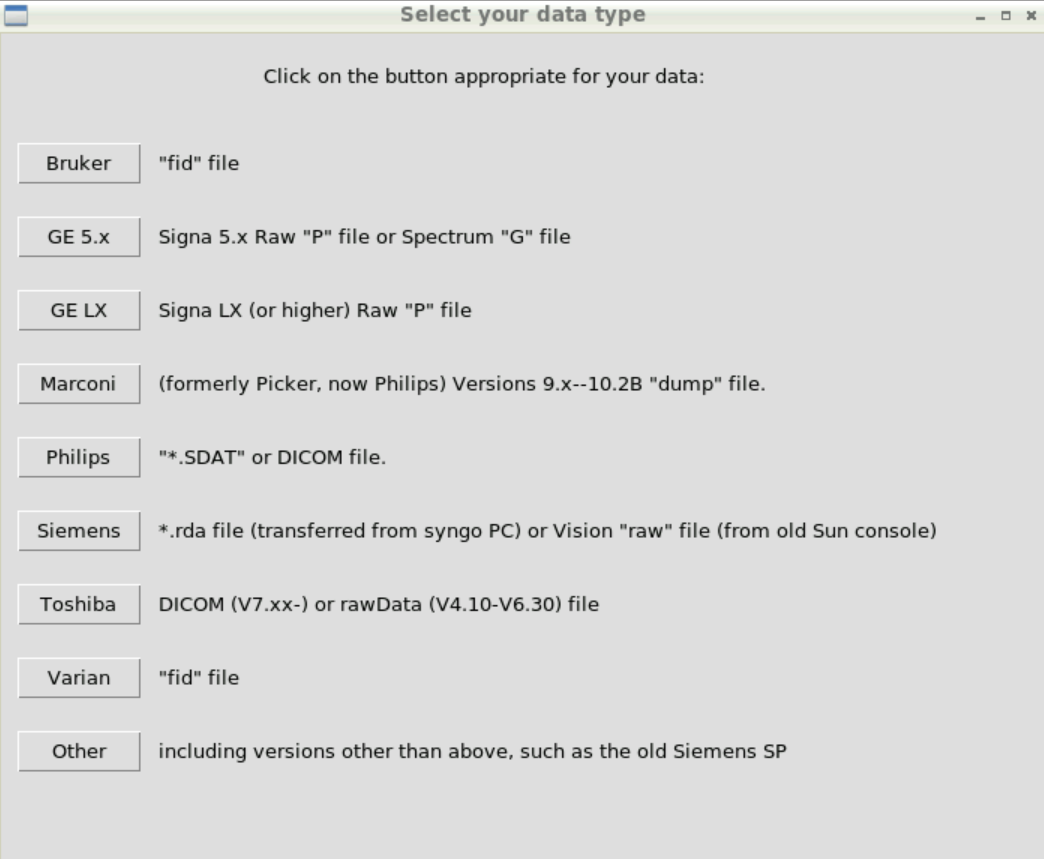 and then select the fid data in: /opt/datasets/Spectra_hippocampus(rat)_TE02/s_20131015_03_BDL106_scan0/isise_01.fid
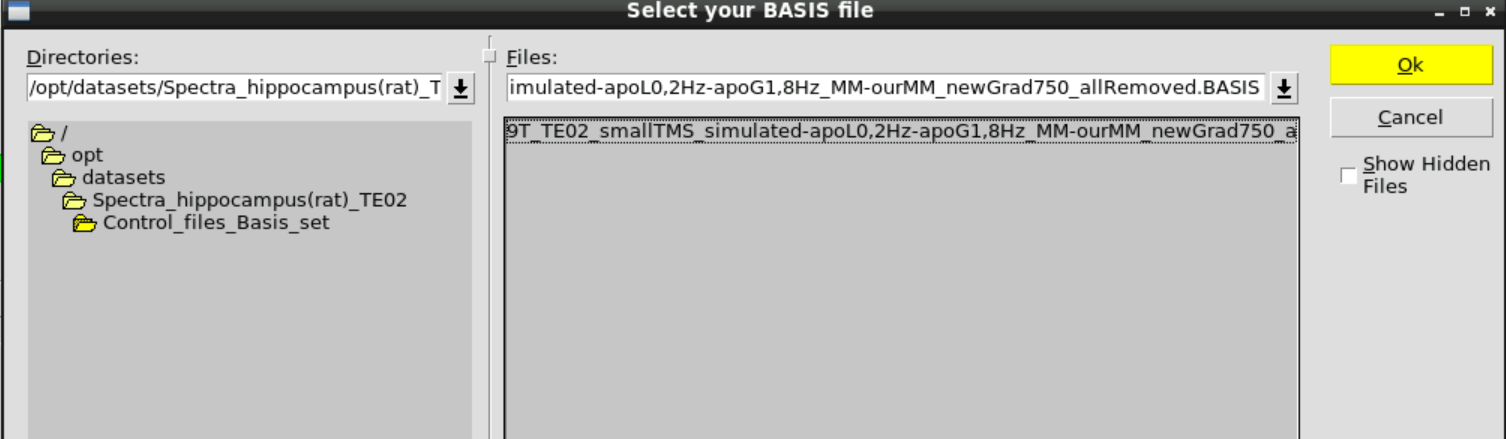
 Then Change BASIS and select the appropriate basis set in /opt/datasets/Spectra_hippocampus(rat)_TE02/Control_files_Basis_set
 Then hit Run LCModel:
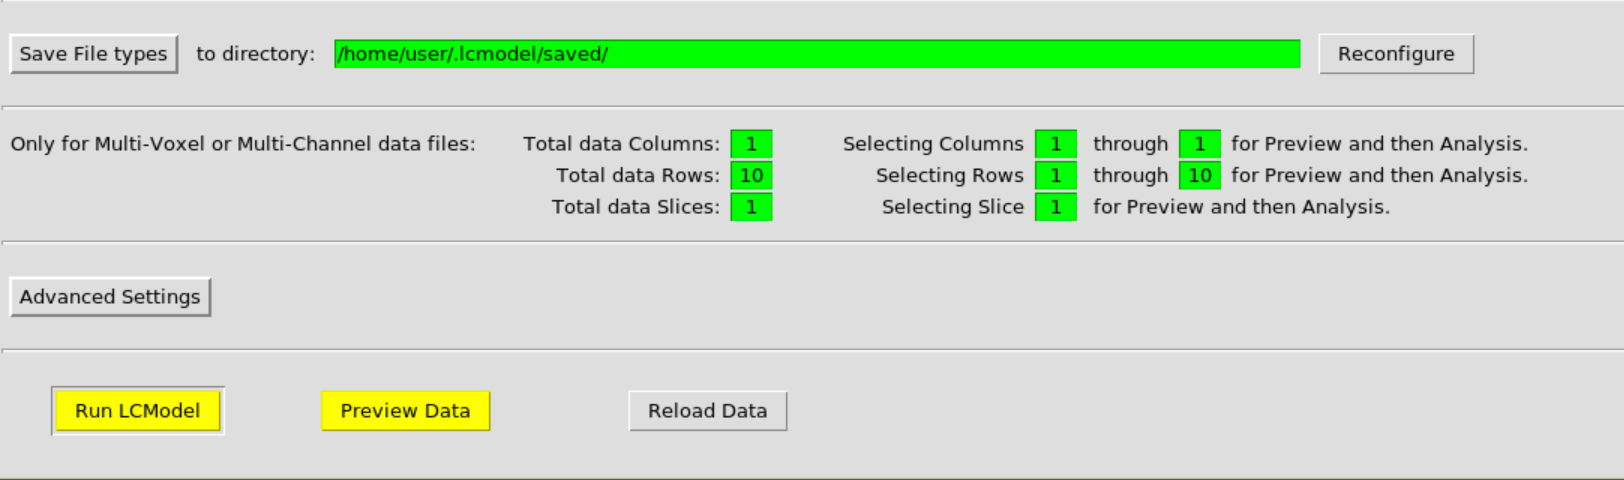 and confirm:
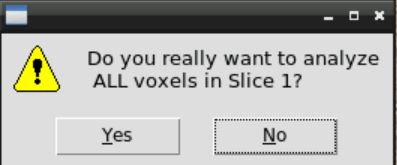 then wait a couple of minutes until the analyzed spectra appear - by closing the window you can go through the results:
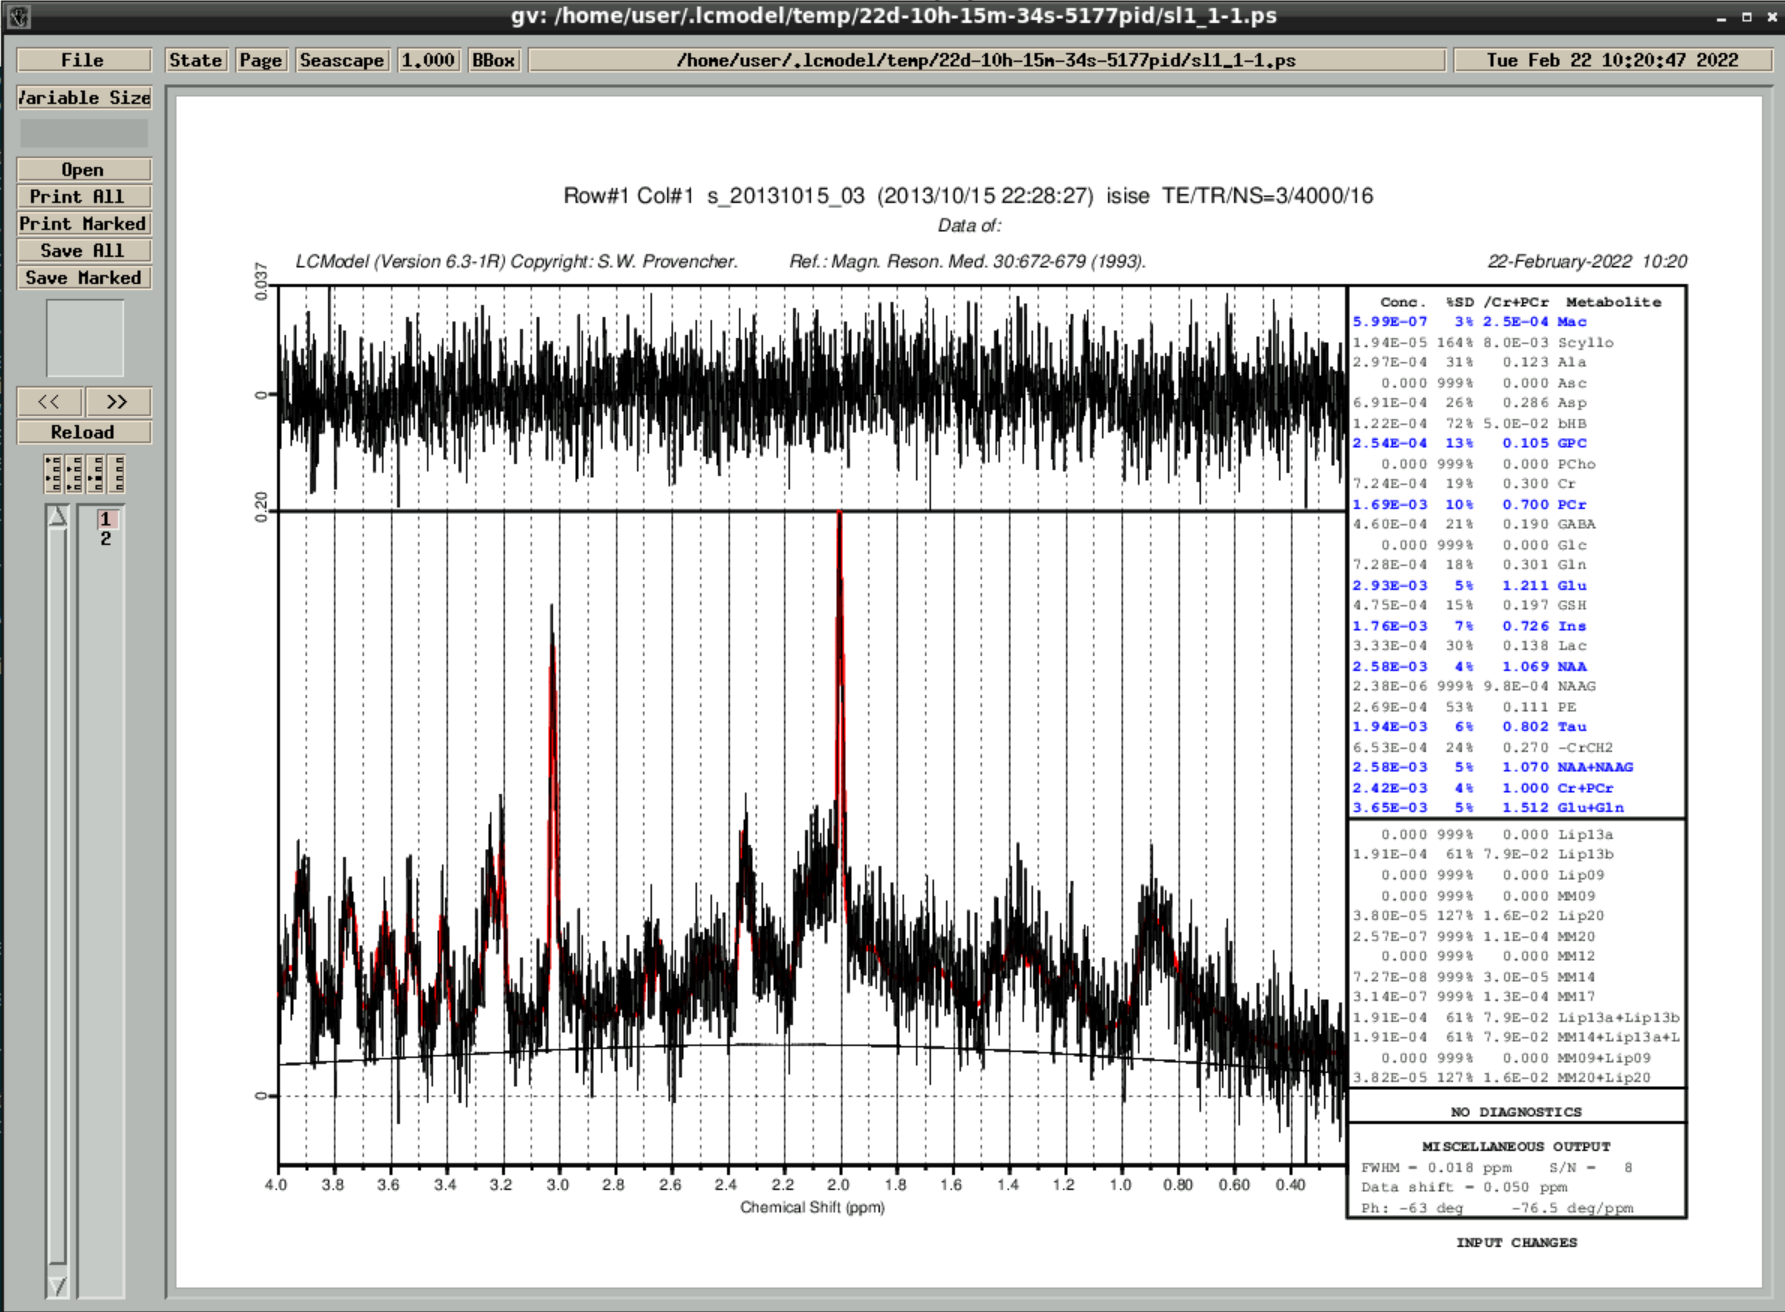 the results are also saved in ~/.lcmodel/saved/