Connectome Workbench
This tutorial was created by Fernanda L. Ribeiro.
Email: fernanda.ribeiro@uq.edu.au
Github: @felenitaribeiro
Twitter: @NandaRibeiro93
This tutorial documents how to use Connectome Workbench on NeuroDesk for visualizing the 7T HCP Retinotopy Dataset.
Getting Setup with Neurodesk
For more information on getting set up with a Neurodesk environment, see hereDownload data
First, make sure you register for the Human Connectome Project Open Access Data: https://www.humanconnectome.org/study/hcp-young-adult/data-use-terms
Register to the BALSA database: https://balsa.wustl.edu/.

- Login and download the scene files containing the retinotopic maps available at: https://balsa.wustl.edu/study/9Zkk.

These files include preprocessed collated data from 181 participants, including retinotopic, curvature, midthickness, and myelin maps.
- Finally, unzip the S1200_7T_Retinotopy_9Zkk.zip file.
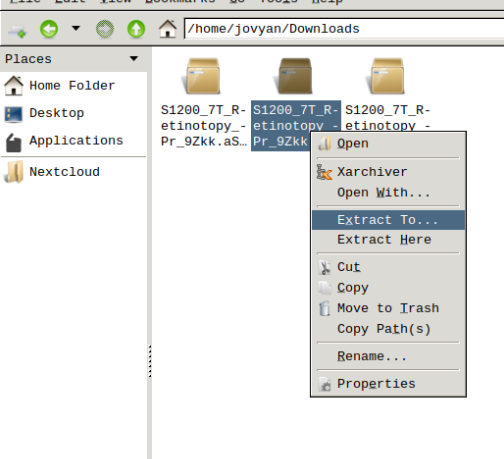
Visualizing scene files
Using Connectome Workbench, you can load “.scene” files and visualize all individuals’ retinotopic maps. To do so, follow the next steps:
- In the application menu, navigate to Neurodesk → functional imaging → connectomeworkbench → connectomeworkbench 1.5.0
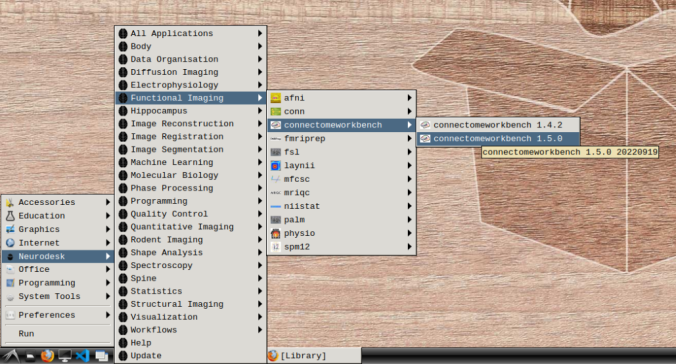
- On the terminal shell that pops up, type in:
wb_view
- Click on “Open Other”

and search for a scene file
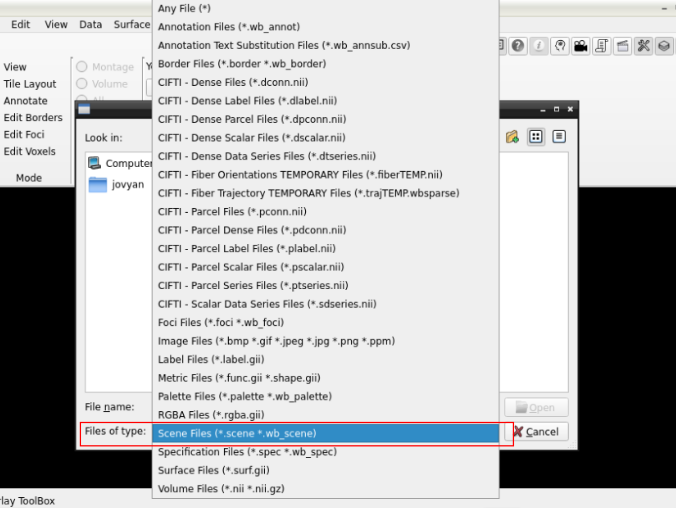
in the path where your data is

Finally, select the desired file and open it:

- On the ‘Scenes’ window that will pop up, select the first option.

The default images are the average maps.
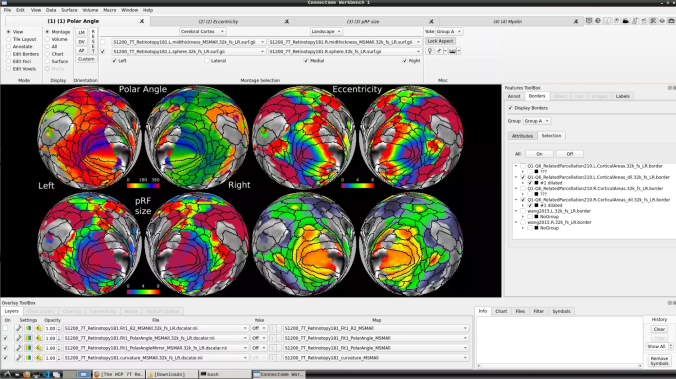
- To change the displayed images for an individual’s data instead, click on the first ticked dropdown menu
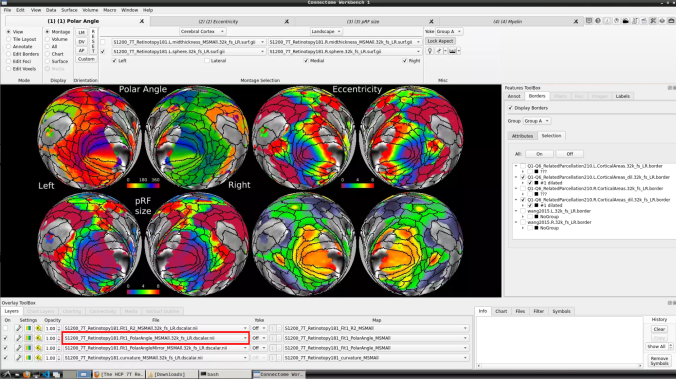
and select “S1200_7T_Retinotopy181.All.Fit1_PolarAngle_MSMALL.32k_fs_LR.dscalar.nii”:
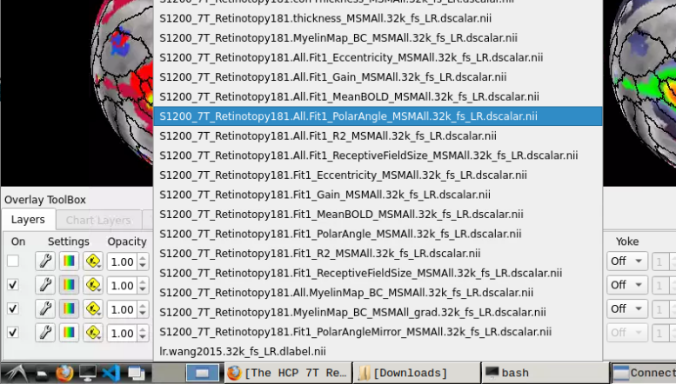
- Now, you should be able to select specific maps from the dropdown menu on the right. For example, here we have the first individual polar angle map (top left):

Now we have the fifth:
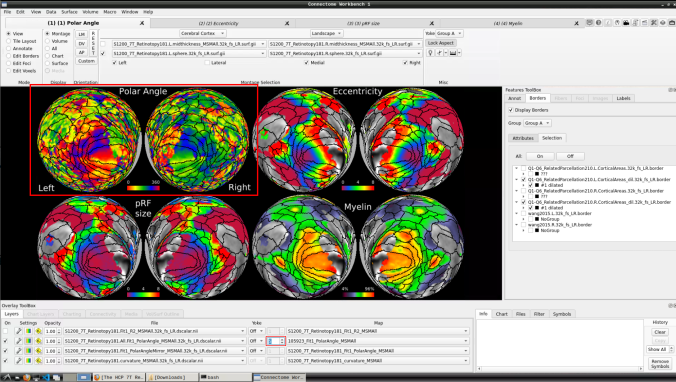
- You can do the same for the other functional maps by navigating through the tabs at the top.
